Prometheus
Prometheus是一个开源监控解决方案,用于收集和聚合指标作为时间序列数据。更简单地说,Prometheus 商店中的每个项目都是一个指标事件,并带有它发生的时间戳。
mac 搭建Prometheus
地址:https://prometheus.io/
Mac 安装
brew install prometheus默认安装路径:
/usr/local/Cellar/prometheus默认配置文件:
/usr/local/etc/prometheus.yml启动
prometheus --config.file=/usr/local/etc/prometheus.yml访问:http://localhost:9090
Spring boot 结合
springboot的web项目,pom依赖:
    <dependencies>
        <!--  web 依赖  -->
        <dependency>
            <groupId>org.springframework.boot</groupId>
            <artifactId>spring-boot-starter-web</artifactId>
        </dependency>

        <dependency>
            <groupId>org.springframework.boot</groupId>
            <artifactId>spring-boot-starter-actuator</artifactId>
        </dependency>

        <dependency>
            <groupId>io.micrometer</groupId>
            <artifactId>micrometer-registry-prometheus</artifactId>
        </dependency>
    </dependencies>
Yml配置文件:
server:
  port: 8080
# 暴露监控端点
management:
  endpoints:
    web:
      exposure:
        include: '*'
监控端点:
http://127.0.0.1:8080/actuator/prometheus
# HELP executor_queued_tasks The Approximate number of tasks that are queued for execution
# TYPE executor_queued_tasks gauge
executor_queued_tasks{name="applicationTaskExecutor",} 0.0
# HELP executor_pool_max_threads The maximum allowed number of threads in the pool
# TYPE executor_pool_max_threads gauge
executor_pool_max_threads{name="applicationTaskExecutor",} 2.147483647E9
# HELP jvm_gc_pause_seconds Time spent in GC pause
# TYPE jvm_gc_pause_seconds summary
jvm_gc_pause_seconds_count{action="end of major GC",cause="Metadata GC Threshold",} 1.0
jvm_gc_pause_seconds_sum{action="end of major GC",cause="Metadata GC Threshold",} 0.072
jvm_gc_pause_seconds_count{action="end of minor GC",cause="Metadata GC Threshold",} 1.0
jvm_gc_pause_seconds_sum{action="end of minor GC",cause="Metadata GC Threshold",} 0.014
# HELP jvm_gc_pause_seconds_max Time spent in GC pause
# TYPE jvm_gc_pause_seconds_max gauge
jvm_gc_pause_seconds_max{action="end of major GC",cause="Metadata GC Threshold",} 0.0
jvm_gc_pause_seconds_max{action="end of minor GC",cause="Metadata GC Threshold",} 0.0
# HELP jvm_classes_loaded_classes The number of classes that are currently loaded in the JAVA virtual machine
# TYPE jvm_classes_loaded_classes gauge
jvm_classes_loaded_classes 7566.0
# HELP jvm_gc_memory_promoted_bytes_total Count of positive increases in the size of the old generation memory pool before GC to after GC
# TYPE jvm_gc_memory_promoted_bytes_total counter
jvm_gc_memory_promoted_bytes_total 3235200.0
# HELP Tomcat_sessions_active_current_sessions
# TYPE tomcat_sessions_active_current_sessions gauge
tomcat_sessions_active_current_sessions 0.0
# HELP executor_pool_size_threads The current number of threads in the pool
配置 prometheus.yml
global:
  scrape_interval: 15s
scrape_configs:
  - job_name: "prometheus"
    static_configs:
    - targets: ["localhost:9090"]
  # 创建job
  - job_name: "tomato-study-prometheus"
    scrape_interval: 5s
    metrics_path: '/actuator/prometheus'
    static_configs:
    - targets: ["localhost:8080"]
重启 prometheus:
http://localhost:9090/targets
安装 grafana
展示各种漂亮的图表。
Mac 安装
brew install grafana默认安装路径:
/usr/local/Cellar/grafana/启动:
grafana-server --config=/usr/local/etc/grafana/grafana.ini --homepath /usr/local/share/grafana --packaging=brew cfg:default.paths.logs=/usr/local/var/log/grafana cfg:default.paths.data=/usr/local/var/lib/grafana cfg:default.paths.plugins=/usr/local/var/lib/grafana/plugins注:如需修改默认端口,可修改
/usr/local/etc/grafana/grafana.ini
访问:http://localhost:3000/ admin/admin
使用前必须更改密码 admin/123qwe
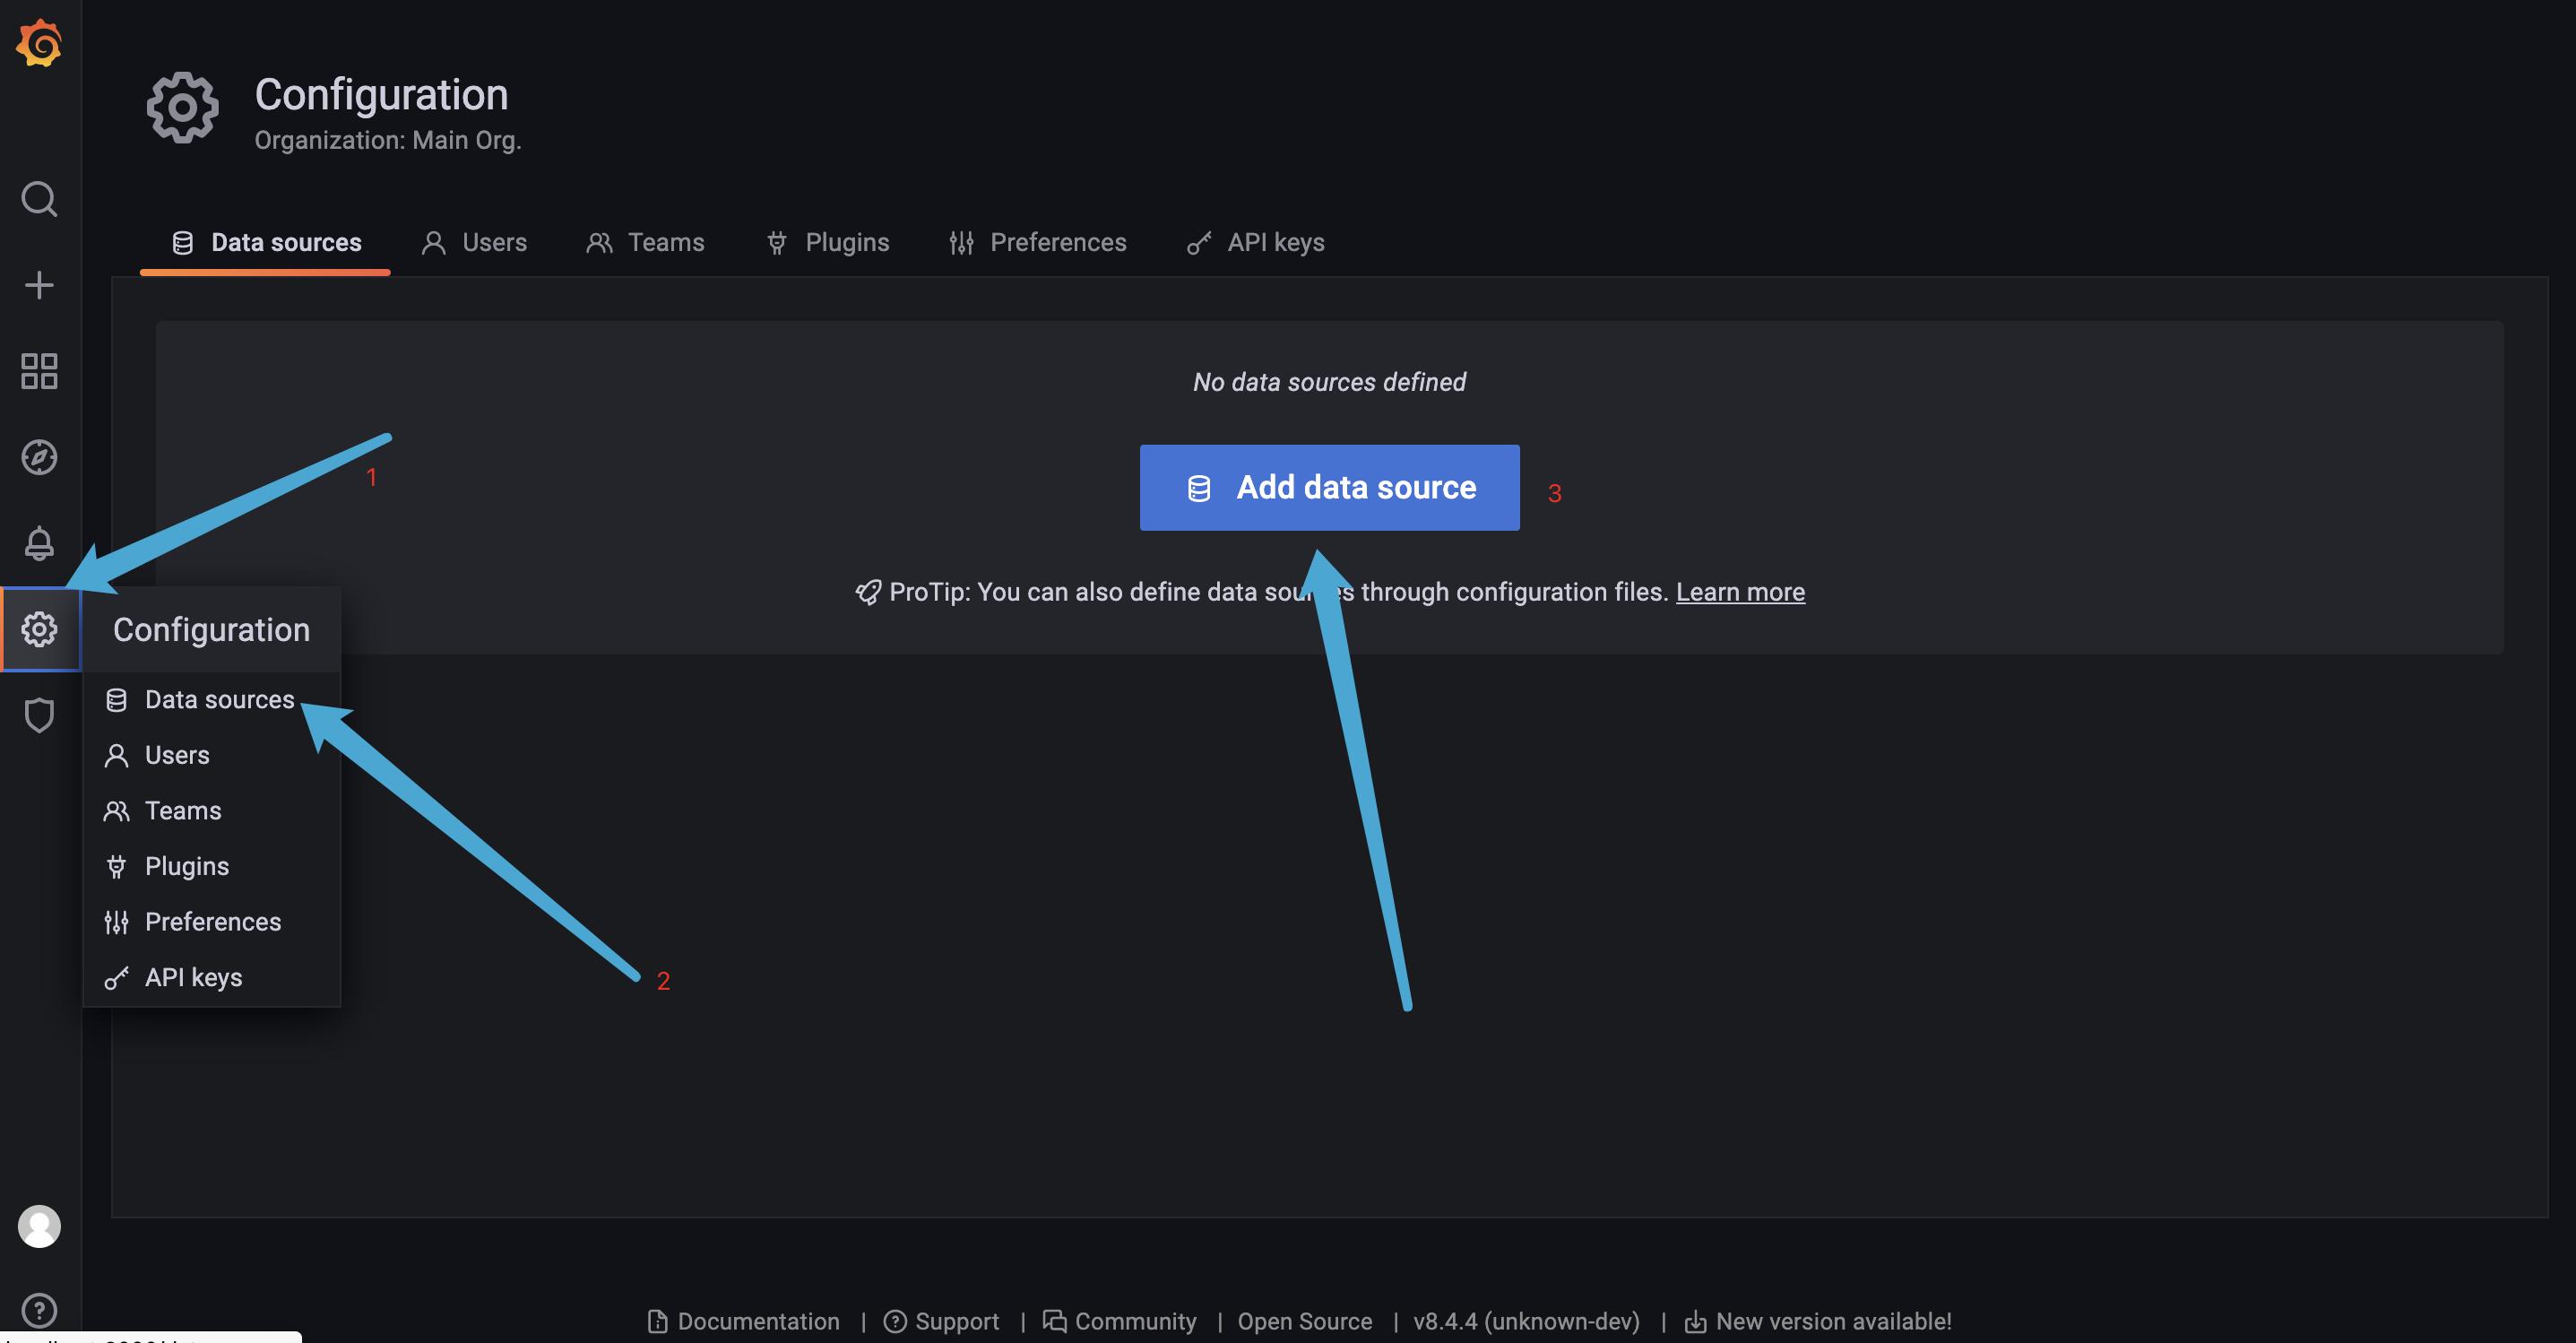
配置 grafana
grafana只是一个图表展示工具,必须添加数据源,才能读取到数据。
配置 Grafana DashBoard文件
推荐的 Grafana DashBoard:
JVM (Micrometer)-(https://grafana.com/grafana/dashboards/4701)
Spring Boot 2.1 Statistics -(https://grafana.com/grafana/dashboards/10280)
Node Exporter - (https://grafana.com/grafana/dashboards/8919)
Druid - https://grafana.com/grafana/dashboards/11157
主机基础监控-(
https://grafana.com/grafana/dashboards/9276)
最终展示效果: